
L'affirmation
“Prévoir une augmentation de la croissance des salaires tout en prévoyant simultanément aucune baisse du chômage. (Ainsi, les employeurs paieraient plus cher sans raison économiquement rationnelle.) Chaque année, ils prévoyaient systématiquement une croissance des salaires optimiste qui n'a à chaque fois pas eu lieu.”
Sources originales
✅ VÉRIFICATION FACTUELLE
Contexte manquant
Évaluation de la crédibilité de la source
Comparaison avec Labor
Perspective équilibrée
PARTIELLEMENT VRAI
7.0
sur 10
Score final
7.0
SUR 10
PARTIELLEMENT VRAI
📚 SOURCES ET CITATIONS (9)
-
1
futurework.org.au
You would think that after 5 consecutive years of wage forecasts that wildly overestimated actual experience, the government might have learned from its past errors – and published a wage forecast more in line with reality. But not this government. They are still trying to convince Australian workers, who haven’t seen real average wages rise in over 5 years, that better times are just around the corner. And rosy wage forecasts are helpful in justifying their equally optimistic revenue forecasts: since if Australians are earning more money, they will be paying more taxes!
The Australia Institute's Centre for Future Work -
2

crikey.com.au
The Morrison government has been forced to recognise the stagnation it is presiding over, slashing wage growth forecasts and revealing big cuts to its forecast budget surpluses.
Crikey -
3
actu.org.au
The ACTU warns this wages turnaround is at risk of being reversed if a Dutton Government is elected, as it has vowed to reverse the wage-boosting rights that have delivered these gains.
Australian Council of Trade Unions -
4

theguardian.com
Tax cuts, surpluses and fancifully optimistic forecasts add up to a make-believe budget
the Guardian -
5
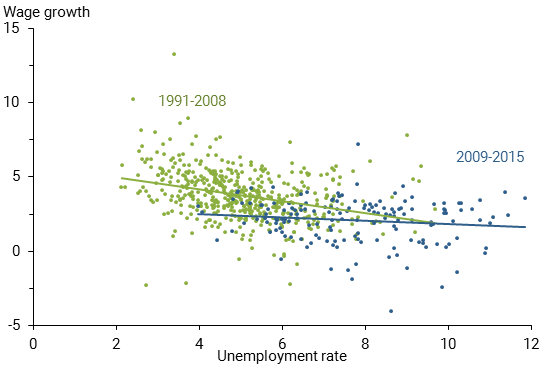
frbsf.org
Although the labor market has steadily strengthened, wage growth has remained slow in recent years. This raises the question of whether the wage Phillips curve—the traditional relationship between labor market slack and wage growth—has weakened. Estimating a causal link from slack to wage growth using national data is difficult. However, using city-level data over the past 25 years shows that the cross-city relationship has weakened since the Great Recession. Explanations consistent with this timing suggest that the Phillips curve may return to a steeper curve in the future.
Federal Reserve Bank of San Francisco -
6
imf.org
Imf
-
7
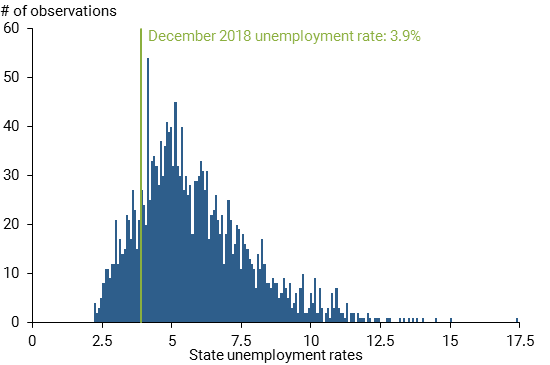
frbsf.org
The unemployment rate ended 2018 at just under 4%, substantially lower than most estimates of the natural rate. Could such an ostensibly tight labor market lead to a sharp pickup in wage growth from its recent moderate pace, such that the relationship between wage growth and unemployment is not always linear? Investigations using state-level data show no economically significant nonlinearity between wage growth and unemployment that would predict an abrupt jump in wage growth.
Federal Reserve Bank of San Francisco -
8
pursuit.unimelb.edu.au
Pursuit Unimelb Edu
-
9
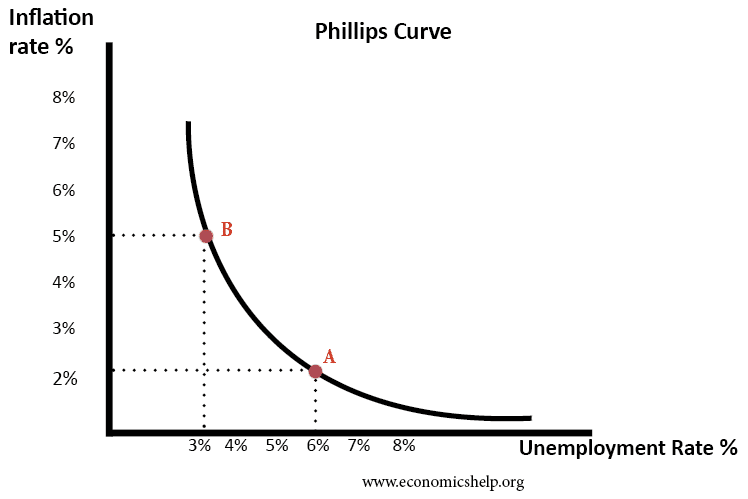
economicshelp.org
Definition of Phillips Curve (trade off between inflation and unemployment). Graphs to show how and why it can occur. real life data. Also different views on Phillips Curve Keynesian vs Monetarist. - short-term and long-term.
Economics Help
Méthodologie de l'échelle de notation
1-3: FAUX
Factuellement incorrect ou fabrication malveillante.
4-6: PARTIEL
Une part de vérité mais le contexte manque ou est biaisé.
7-9: MAJORITAIREMENT VRAI
Détails techniques mineurs ou problèmes de formulation.
10: EXACT
Parfaitement vérifié et contextuellement équitable.
Méthodologie: Les notations sont déterminées par recoupement des documents gouvernementaux officiels, des organisations indépendantes de vérification des faits et des documents sources primaires.