
The Claim
“Wages growing at 4% annually (highest in 15 years), 2.62 million employees covered by agreements (highest since 2014)”
Original Sources Provided
✅ FACTUAL VERIFICATION
The claim contains two distinct assertions that require separate evaluation.
Wages growing at 4% annually: This is only partially accurate and depends heavily on which wage metric is used. The Wage Price Index—the official government measure of wage growth—was at 3.2% in September 2025 in the private sector and 3.8% in the public sector [1]. These figures are below the claimed 4% level. However, Average Weekly Earnings (a different measure including composition effects) reached 4.6% annually in November 2024, with private sector earnings at 4.8% [2]. The claim appears to conflate different wage measures or cherry-pick the highest figure from available data.
Regarding whether this represents the "highest in 15 years": The Wage Price Index has not reached 4% in recent data [1]. Average Weekly Earnings of 4.6% in November 2024 is described as "the highest annual growth since May 2020," not the highest in 15 years [2]. The claim overstates the historical comparison.
Real wage growth (adjusted for inflation) has been positive but modest. Real wages grew by 0.8% in the year to December 2024 [2], which is meaningful but not exceptional. This follows years of negative real wage growth during the Coalition government.
2.62 million employees covered by agreements: The available data does not support the specific figure of 2.62 million. As of March 2024, enterprise agreement coverage was 2.14 million employees [3]. More recent data from the Fair Work Commission indicates that 21.3% of workers were covered by enterprise agreements, described as "the first time more than 20% of workers have been covered by EBAs since June 2020" [3][4]. The 2.62 million figure cannot be verified from official sources.
Whether this represents the "highest since 2014" also cannot be definitively confirmed. March 2024 coverage of 2.14 million is higher than recent years shown in available data (1.74 million in March 2023, 2.03 million in December 2023), but comparison to 2014 levels would require historical data not provided in current sources [3].
Missing Context
Several important contextual elements are absent from the claim:
Wage measure ambiguity: The claim doesn't specify whether it refers to the Wage Price Index (the official measure at 3.2-3.8%), Average Weekly Earnings (4.6%), or enterprise agreement wages (4.8% for covered workers) [1][2][3]. These are substantively different figures, and choosing the highest one misrepresents the typical wage growth experience.
Real vs. nominal wages: While nominal wages have grown, real wage growth (adjusted for inflation) remains modest at 0.8% [2]. This is meaningful but far less impressive than the nominal figure suggests.
Composition effects in Average Weekly Earnings: The 4.6% Average Weekly Earnings growth includes changes in hours worked and employment composition, not just wage rate increases [2]. Pure wage rate growth (Wage Price Index) is lower at 3.2-3.8% [1].
Unverified 2.62 million figure: The claim provides a specific number without corroboration. Official data shows 2.14 million as of March 2024 [3].
Enterprise agreement specifics: Workers covered by enterprise agreements have experienced 4.8% average annual wage growth, which exceeds the general workforce average [3]. However, this represents only a subset of workers, and the claim doesn't clarify this distinction.
International and historical context: While wage growth has improved from the Coalition years (2.2% average 2013-2022), it remains in the low range historically and internationally [2]. The "highest in 15 years" claim for 4% growth is not supported by available data.
Implementation attribution: The claim doesn't clearly state whether these outcomes result from Labor government policy (Fair Work reforms, enterprise agreement changes) or broader economic factors (wage pressures from low unemployment, composition shifts, demand for workers).
💭 CRITICAL PERSPECTIVE
The claim presents wage growth in the most favorable light possible through selective use of metrics. If the intention is to describe the 4.6% Average Weekly Earnings growth (the highest figure cited), that is real but misleading because [2]:
- It includes compositional changes and increased hours worked, not just wage rate improvements [2]
- The true wage rate growth (Wage Price Index) remains 3.2-3.8%, below the claimed 4% [1]
- Real wage growth is only 0.8% when adjusted for inflation [2]
The enterprise agreement coverage claim cannot be verified at the stated 2.62 million level. Official data shows 2.14 million as of March 2024, with recent data indicating 21.3% coverage—meaningful growth but not at the claimed level [3][4].
The Fair Work reforms, including the enhanced enterprise bargaining framework, have contributed to increased enterprise agreement coverage and wage growth for covered workers [3][4]. This represents a genuine policy achievement. However:
- The claim overstates the scale of wage growth by using the highest available metric rather than the standard Wage Price Index [1]
- Real wage growth remains modest despite nominal growth [2]
- The 2.62 million coverage figure appears to be unverified
- The claim doesn't distinguish between policy-driven outcomes and broader economic labor market tightness
Workers covered by enterprise agreements have indeed benefited from stronger wage outcomes (4.8% average wage growth), suggesting the Fair Work reforms are having positive effects [3]. However, the overall claim presents selective evidence in a misleading manner.
PARTIALLY TRUE
4.5
out of 10
Some wage growth has occurred and is above historical Coalition government averages. However, the claim conflates multiple wage measures to cite the highest figure (4.6% Average Weekly Earnings), actual wage rate growth remains 3.2-3.8% (below 4%), real wage growth is only 0.8%, and the 2.62 million enterprise agreement coverage figure cannot be verified from official sources (available data shows 2.14 million as of March 2024).
Final Score
4.5
OUT OF 10
PARTIALLY TRUE
Some wage growth has occurred and is above historical Coalition government averages. However, the claim conflates multiple wage measures to cite the highest figure (4.6% Average Weekly Earnings), actual wage rate growth remains 3.2-3.8% (below 4%), real wage growth is only 0.8%, and the 2.62 million enterprise agreement coverage figure cannot be verified from official sources (available data shows 2.14 million as of March 2024).
📚 SOURCES & CITATIONS (5)
-
1
Wage Price Index, Australia, September 2025
The WPI measures changes in the price of labour, unaffected by compositional shifts in the labour force, hours worked or employee characteristics
Australian Bureau of Statistics -
2
Average Weekly Earnings, Australia, November 2024
Estimates of weekly earnings classified by industry, sector, state and territory
Australian Bureau of Statistics -
3
Trends in Federal Enterprise Bargaining - March quarter 2024
Dewr Gov
-
4
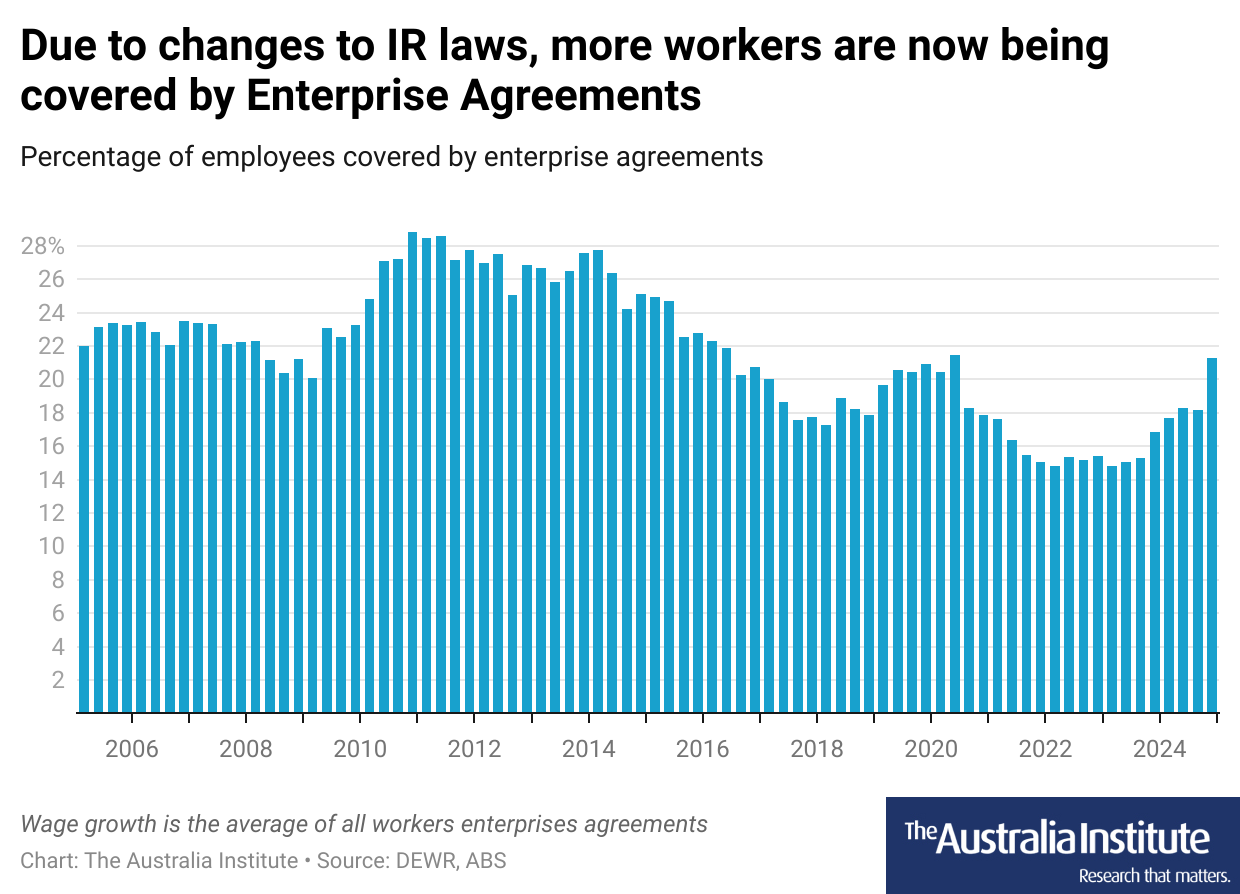
Increased enterprise agreements and wages show the government's IR policy is working
The changes to industrial relations show that bold policy delivers good outcomes.
The Australia Institute -
5
Developments in Wages Growth Across Pay-setting Methods
The dynamics of wages growth can differ across pay-setting methods.
Reserve Bank of Australia
Rating Scale Methodology
1-3: FALSE
Factually incorrect or malicious fabrication.
4-6: PARTIAL
Some truth but context is missing or skewed.
7-9: MOSTLY TRUE
Minor technicalities or phrasing issues.
10: ACCURATE
Perfectly verified and contextually fair.
Methodology: Ratings are determined through cross-referencing official government records, independent fact-checking organizations, and primary source documents.